Measuring biodiversity on the ground takes a lot of time and a lot of money. If you’ve ever tried counting how many types of trees are in a forest or the number of animals that live there, you would find that it’s an almost insurmountable task.
But satellites could make the grunt work go away. Satellite imagery gets better and more ubiquitous every day as new satellites are launched and old ones are updated. The European Space Agency just launched the Sentinel-2 satellite at the end of June and it’s already sending back incredible images that scientists are using to monitor biodiversity.
Over the past several years, scientists have been actively involved in getting biodiversity to the forefront of interest. In 2010, a United Nations convention set 20 biodiversity targets for countries to meet by 2020, ranging from halving the rate of habitat loss to sustainably harvesting fish. The problem is it’s tough to know if nations have met these goals without knowing what to measure and how to measure it.
Last month, more than a dozen conservation biologists wrote an op-ed in Nature, published online July 22, calling for a universal method of measuring biodiversity via satellites. The authors proposed 10 variables to measure, from wildfire frequency to species abundance. This November, the Group on Earth Observation Biodiversity Observation Network, an international consortium that counts NASA and others as a partner, plans to meet and hopefully agree on essential variables to measure biodiversity from satellites.
NASA’s Applied Sciences Program has used satellites to study Earth’s ecology for years, according to its 2014 annual report released today. One tool highlighted in the report is EnvDATA, a database where researchers can input their data on species’ movements and compare it to satellite imagery and data on weather patterns, vegetation, and human population density. Scientists at the U.S. Geological Survey Northern Rocky Mountain Science Center in Montana are using EnvData to study condor migration, for example.
Here are a few other ways satellites are helping to measure biodiversity:
Pretty Useful Colors
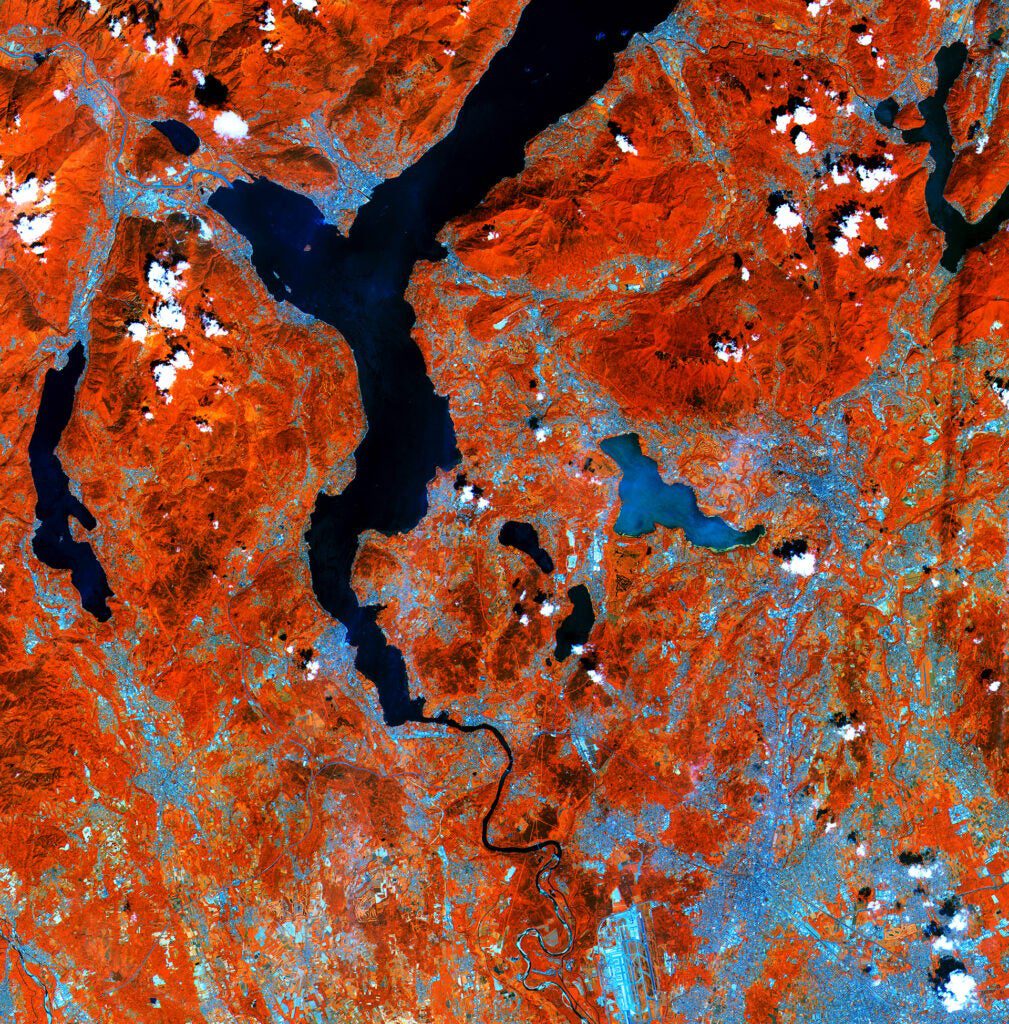
This stunning image of the Italian Alps, from Sentinel-2, was captured just four days after the satellite launched. The trippy colors come from the infrared processing. Red represents healthy vegetation, the dark blue areas are lakes, and the lighter blue areas shows a glacial lake.
Easy To Spot, Hard To Track
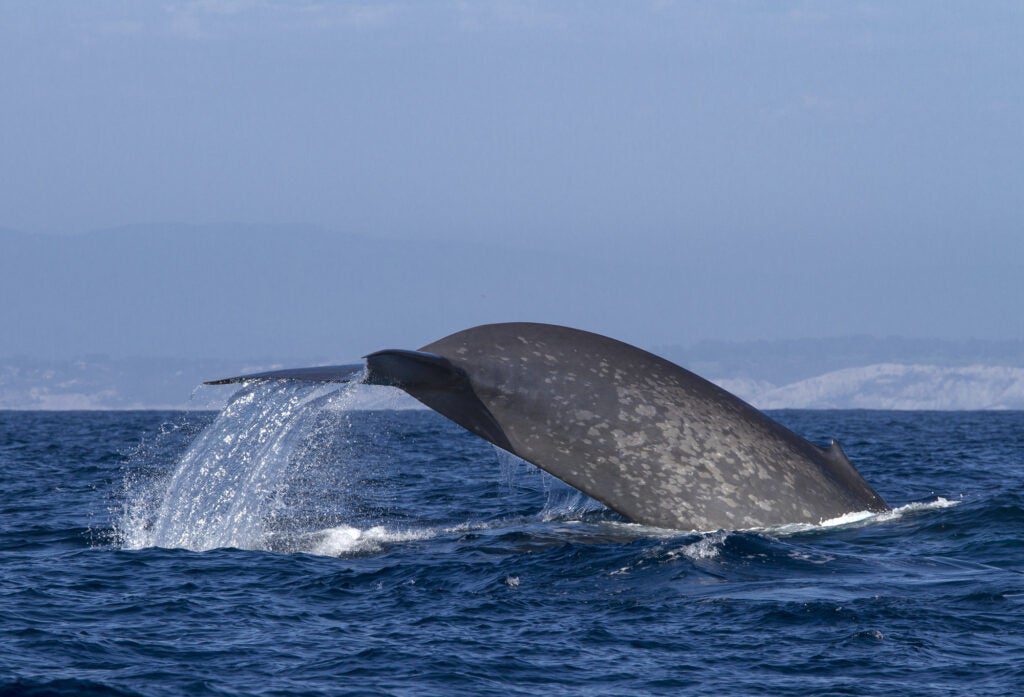
Humans continue to be a dangerous threat for whales – four blue whales were killed as a result of California ship strikes in 2007 and 18 humpback whales were found entangled in fishing gear between 2004 and 2008. Researchers from the University of Maryland, Oregon State University, and the National Oceanic and Atmospheric Administration, have tagged whales off the coast of California with satellite monitors (including the one in this photo). They’re combining that tracking information with environmental data to develop models that can predict where whales will be so humans can avoid – and protect – the majestic sea creatures. Their predictive tool, called WhaleWatch, will be available to the public later this year.
Flowing Into The Nordenskiöld Fjord
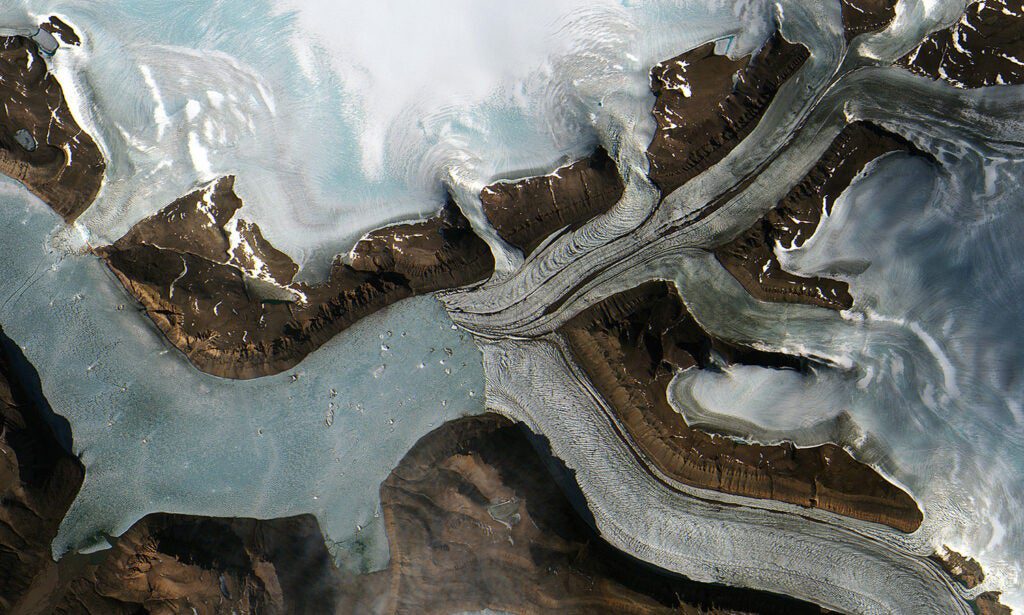
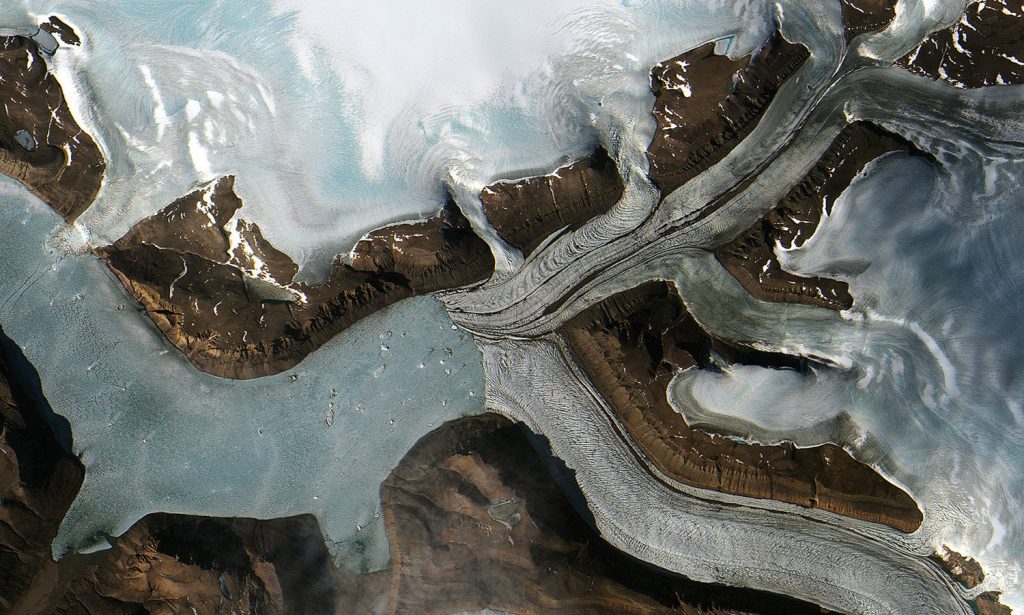
The European Space Agency’s newly launched satellite, Sentinel-2, captured this image of the Jungersen Glacier in northern Greenland on July 28. Satellites are able to monitor glaciers as they migrate and melt.
The Cutest Application
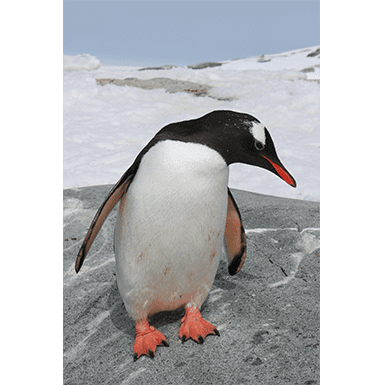
Penguins, in addition to their adorable qualities, are actually useful indicators for ecosystem health. Stonybrook University researchers are using NASA satellites to measure penguin distribution and population size. By monitoring these factors, scientists can determine how healthy the Southern Ocean ecosystem is.
Better Than The Human Eye
These images of Lagunas Pastros Grandes in Bolivia (which translates to Big Pastures Lake) show some of the color processing that satellites are capable, and that the human eye can’t see on its own. The first image on the left is the unprocessed version, the center one uses infrared to show water in red, salt in yellow and evaporated deposits in gold. The third image also uses infrared to highlight the geologic features of the volcano surrounding the lake in brown and green. The lake is very salty, with deposits of lithium, potassium, and boron.
Coral Reef Watch
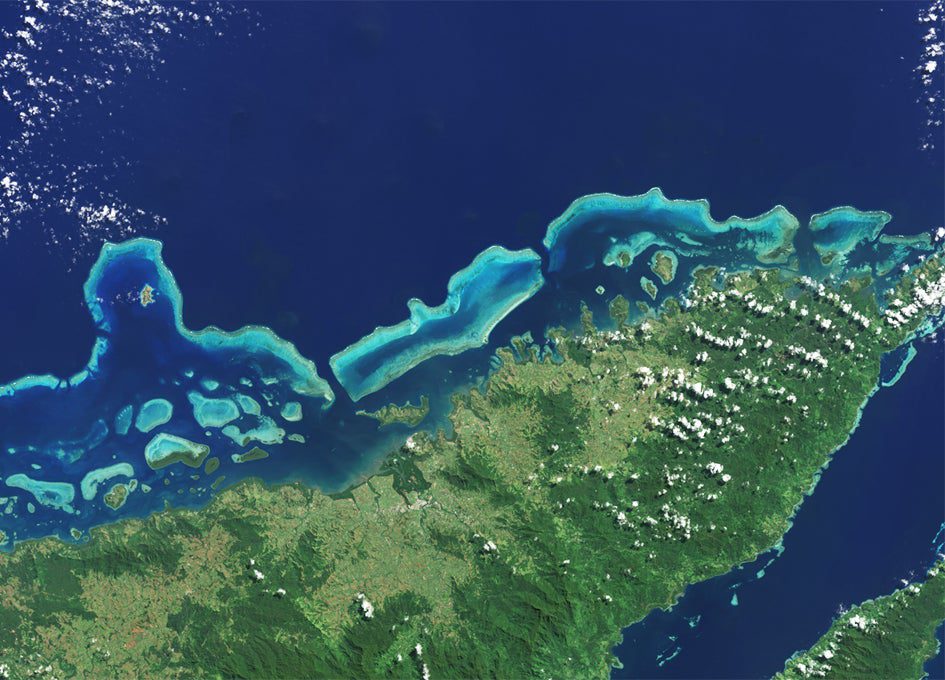
NOAA uses the Landsat 8 satellite to monitor the health of coral reefs, like the one seen here off the coast of Vanua Levu in Fiji.
Eyes On Wildfires
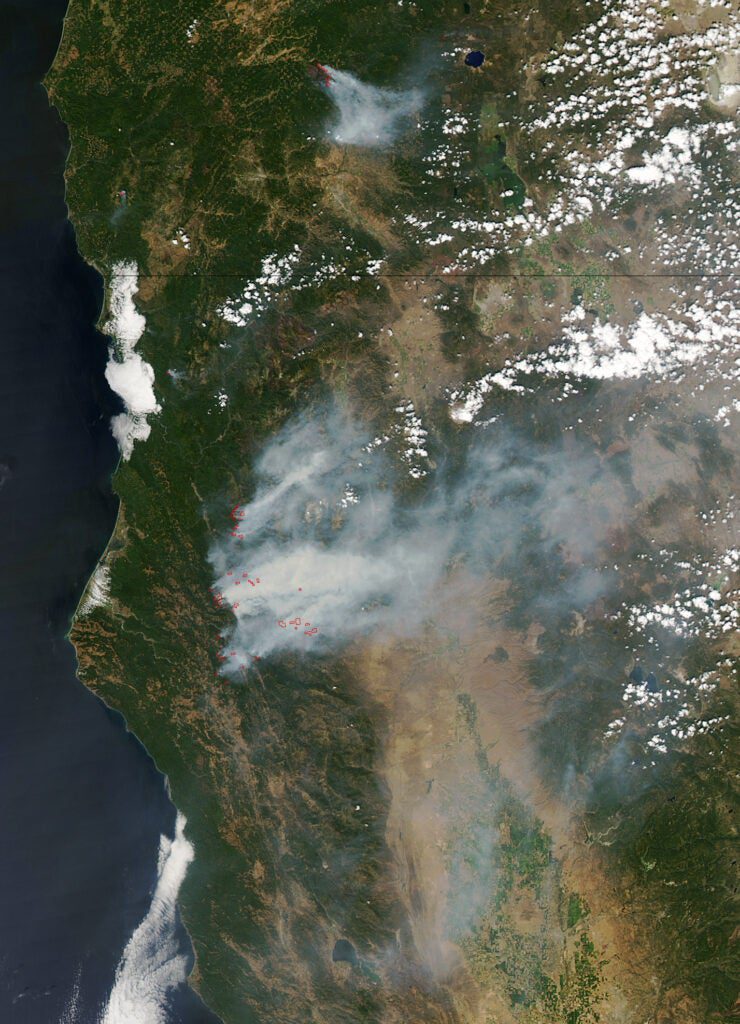
While firefighters battle the wildfires in the west on the ground, NASA is monitoring them from the sky. In this image, taken with the Aqua satellite on August 5, the Rocky Fire burn scar can be seen in brown at the bottom of the image, and the River Complex Fire and Fork Complex Fire can be seen in the smoky areas in the center. The Stouts Fire can also be seen in the clouds at the top. More than five million acres of land have burned in Alaskan wildfires this year, and more than 230,000 acres are currently burning in California.
