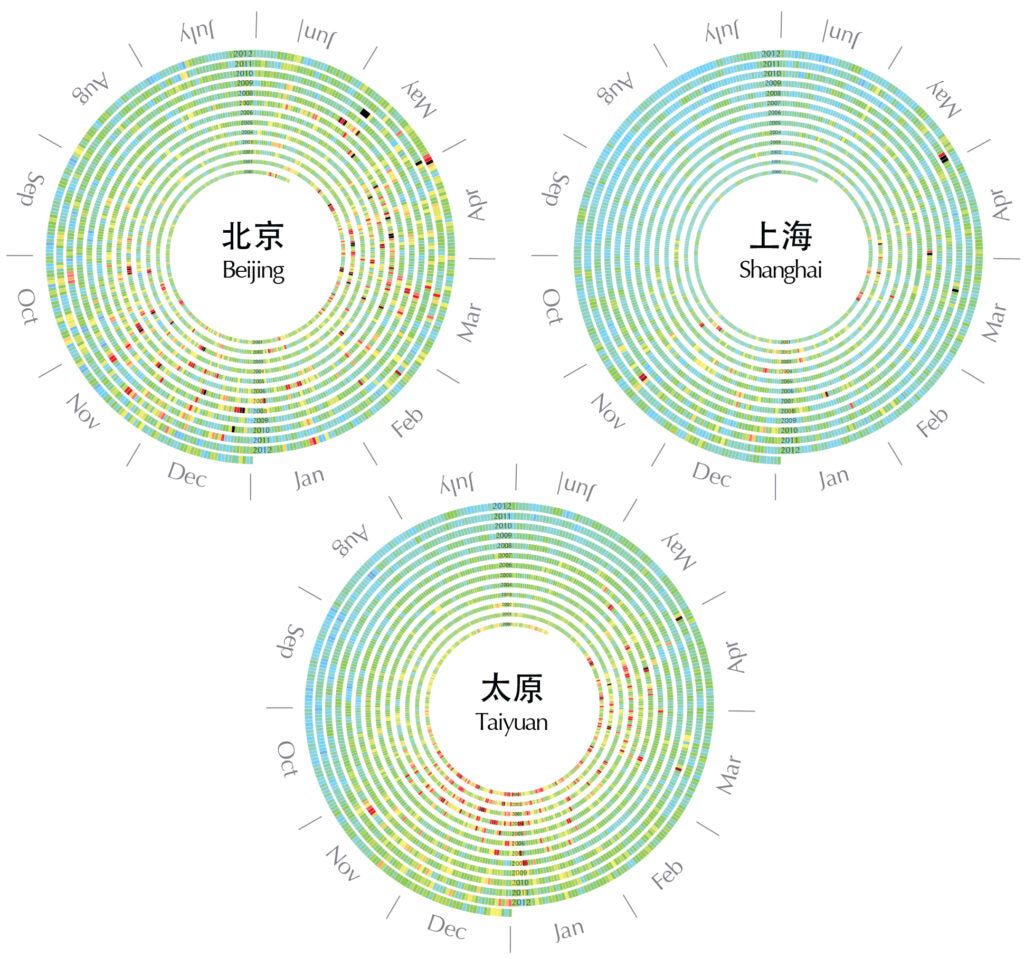
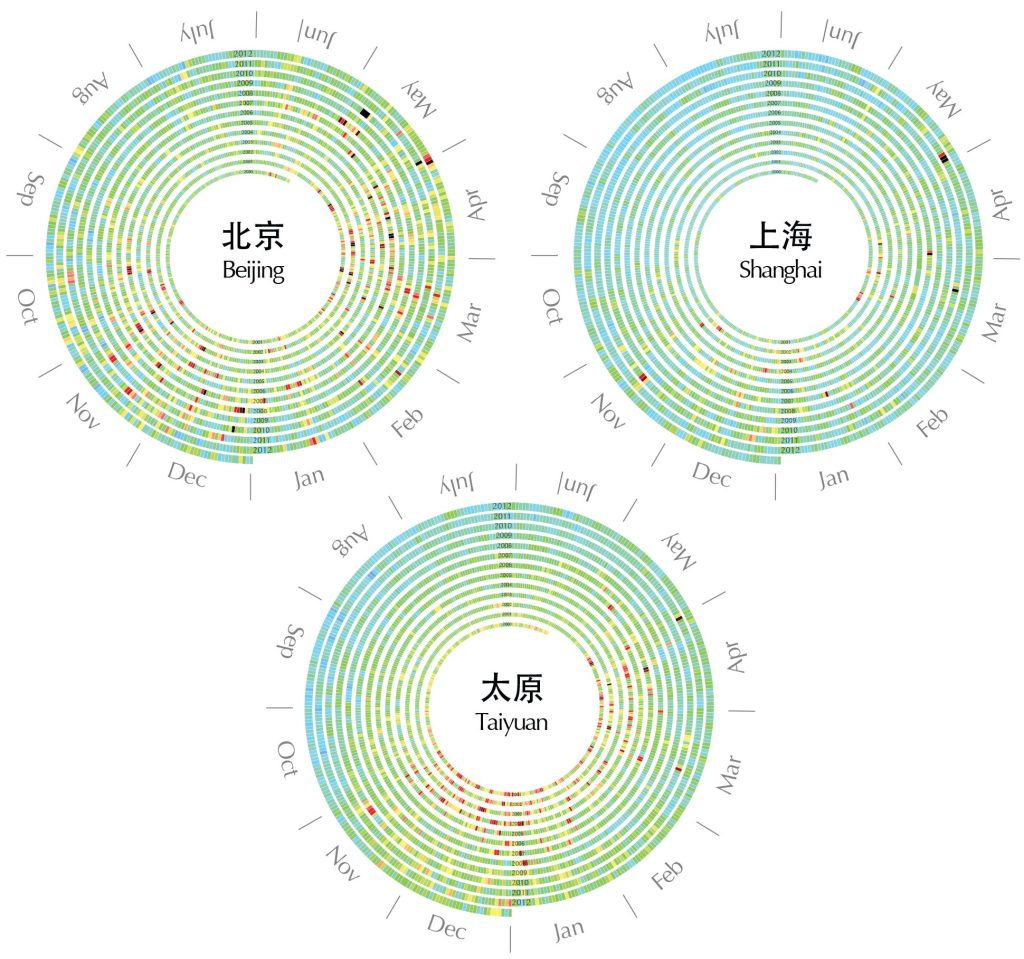
Xiaoji Chen set out to find patterns in the air pollution that plagues Chinese cities. Using data from the country’s Ministry of Environmental Protection, she created spirals that reveal the annual cycles of winter air pollution and spring sandstorms. The year 2000 appears at the center and 2013 at the outer edge, with the more severe pollution in red. On the right is industrial Taiyuan in northeast China, which suffered from air pollution so extreme that in the early 2000s, the government intervened to make the city’s factories more efficient. A marked improvement is visible in Taiyuan’s spiral starting in the middle of the decade.
See all 15 of our favorite recent data visualizations here.
This article was originally published in the November 2014 issue of Popular Science, under the title, “Dawn of the Data Age.”

Sky Color


