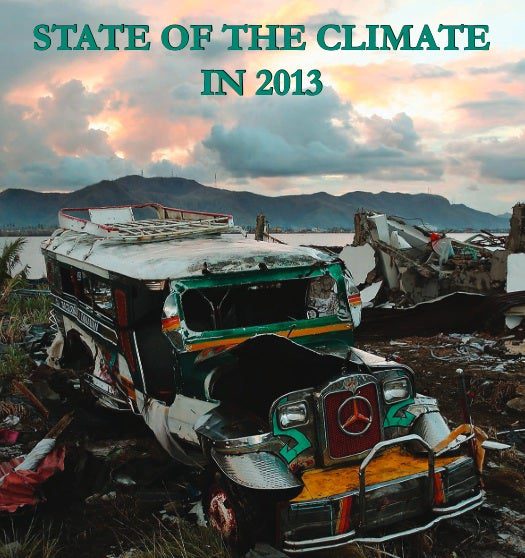
The cover image of “State of the Climate in 2013,” makes the impact of the report, which was released today, clear. Taken in late November on the island of Leyte, Philippines during the aftermath of Super Typhoon Hainan, it shows a wrecked mini-bus sits askew in a debris-scattered field, its front hood curved like a sneering lip, beneath a sky half-full of bruise-colored clouds. Just beyond, a shirt flutters on a clothesline tangled in the jagged remains of a collapsed building.
The global data and analysis compiled in “State of the Climate in 2013” show that last year the Earth’s surface continued to warm beyond the historic norms found in records going back hundreds or even thousands of years, sometimes with catastrophic results. Among the notable indicators of climate disruption noted in the report:
- Globally, the Earth’s combined land and sea surface temperature was between the second and sixth warmest since record-keeping began in 1880. But 2013 saw a plateau in the cooling effect of cyclical “La Nina” conditions over the Pacific Ocean. Scientists are now on watch for the start of “El Nino,” the cyclical warming trend that could further intensify the rate of global temperature increases.
-
CO2 levels hit 400 ppm on May 9, 2013, for the first time in the history of monitoring at the Mauna Loa Observatory (the famous-to-climate-geeks Keeling project)
2013’s record high sea level may have contributed to Super Typhoon Haiyan’s devastating force. The storm, which made landfall on November 8, 2013, is the deadliest in Philippines history, with around 6,300 people killed and over 1,000 yet missing. Haiyan also left 4 million people homeless, and affected 16 million people overall.
The Category 5 storm is likely to go down as the strongest-at-landfall tropical cyclone ever recorded, with one-minute sustained winds at 170 knots (196 mph) when it first hit islands in the southern Philippines. The low-lying coastal city of Tacloban was destroyed by the storm’s 24.6-foot sea surge.
Sea level around the central Philippines has risen 7.9 inches since 1970, according to NOAA.
NOAA has put the report’s highlights online at climate.gov, and the full report is up at the National Climate Data Center.


